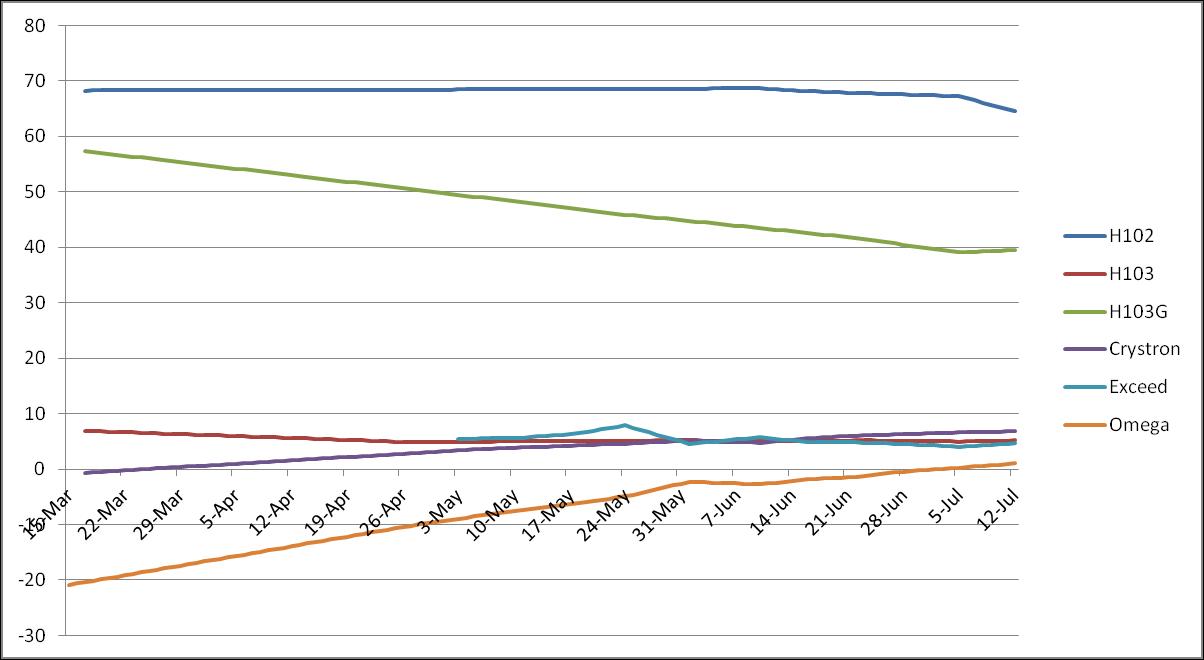
Performance Data for my 4 MHz Collection
Graph showing rates in Seconds Per Year for each of my 4 MHz watches
Table showing deviation from Standard Time in seconds for each of my 4 MHz watches
| Date | H102 | H103 | H103G | Crystron | Exceed | Omega |
| 26th Feb. 2016 | -0.1 | -0.1 | 0 | -0.5 | 0.4 | |
| 15th Mar. 2016 | -0.5 | |||||
| 17th Mar. 2016 | 3.5 | 0.2 | 3 | -0.1 | ||
| 11th Apr. 2016 | -5 | |||||
| 14th Apr. 2016 | -5.8 | |||||
| 18th Apr. 2016 | -6.6 | |||||
| 27th Apr. 2016 | 11.2 | 0.6 | 8.3 | -8.8 | -1.2 | |
| 3rd May 2016 | -8.7 | |||||
| 6th May 2016 | 1.3 | -1.1 | ||||
| 10th May 2016 | -8.6 | |||||
| 18th May 2016 | -8.4 | |||||
| 24th May 2016 | 16.3 | 1 | 10.9 | 2 | -8.2 | -0.7 |
| 1st Jun. 2016 | 17.8 | 1.2 | 11.6 | 2.3 | -8.1 | -0.1 |
| 10th Jun. 2016 | 19.5 | 1.3 | 12.4 | 2.3 | -7.9 | -0.2 |
| 16th Jun. 2016 | 20.5 | 1.3 | 12.8 | 2.7 | -7.9 | 0 |
| 22nd Jun. 2016 | 21.5 | 1.5 | 13.2 | 3.1 | -7.8 | 0 |
| 29th Jun. 2016 | 22.7 | 1.5 | 13.5 | 3.4 | -7.7 | 0.3 |
| 5th Jul. 2016 | 23.7 | 1.6 | 13.8 | 3.6 | -7.7 | 0.5 |
| 12th Jul. 2016 | 24 | 1.7 | 14.7 | 3.8 | -7.6 | 0.8 |
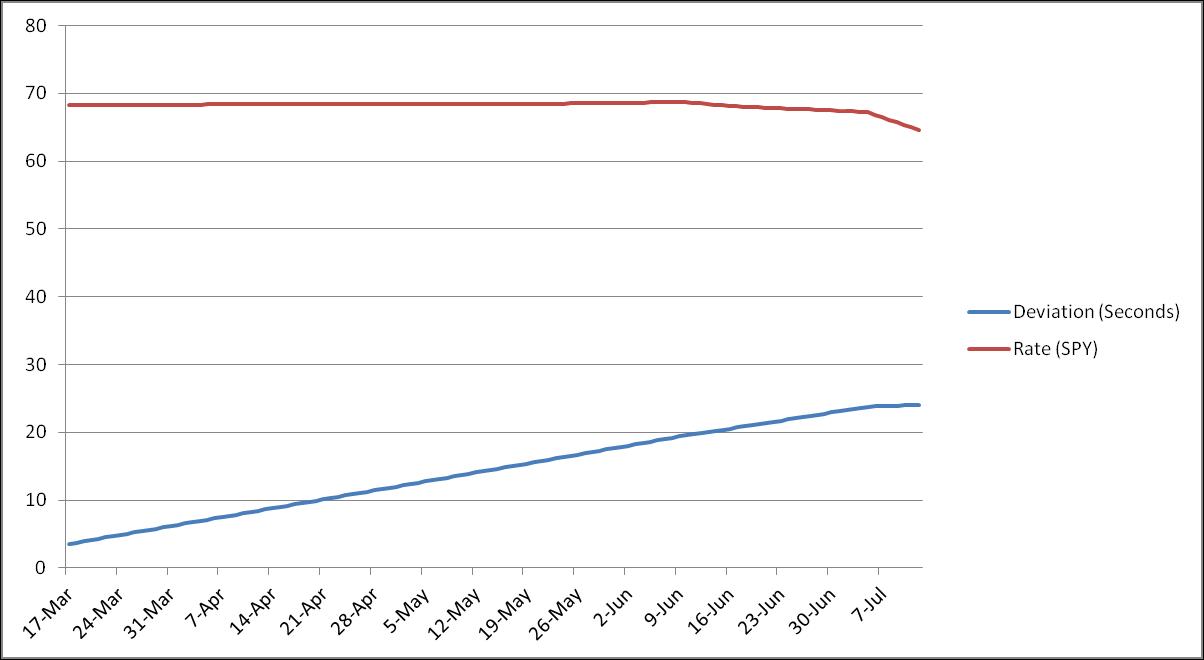
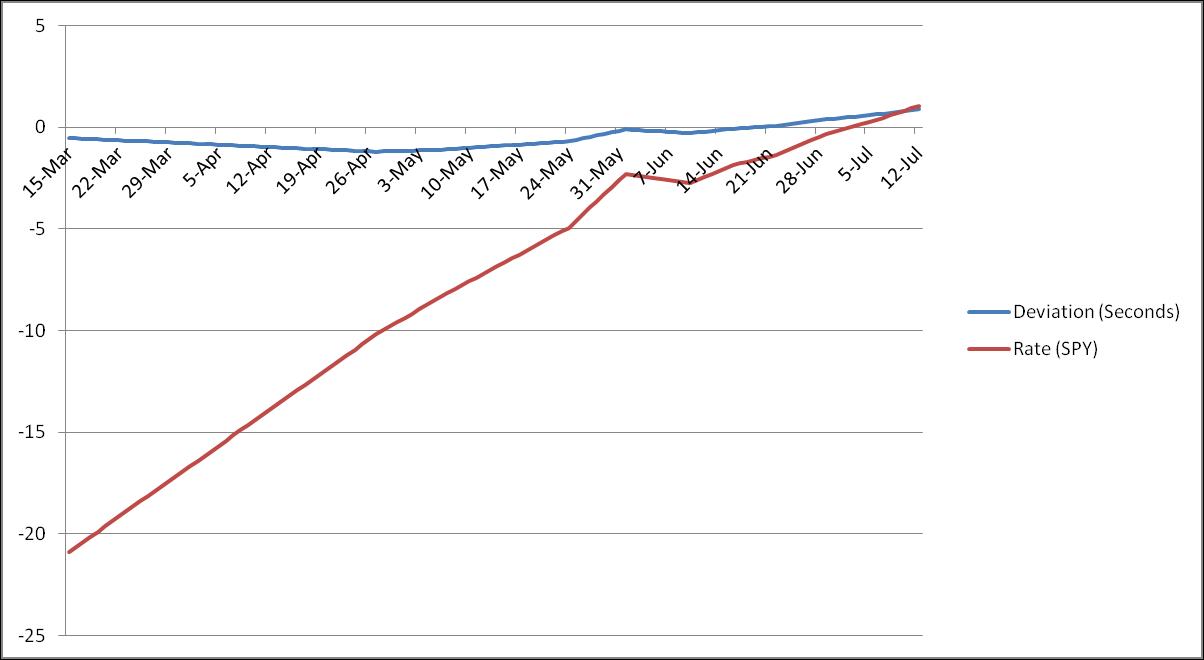
Graph showing the deviation from Standard Time (in seconds) and rate (in seconds per year) for the SP-410
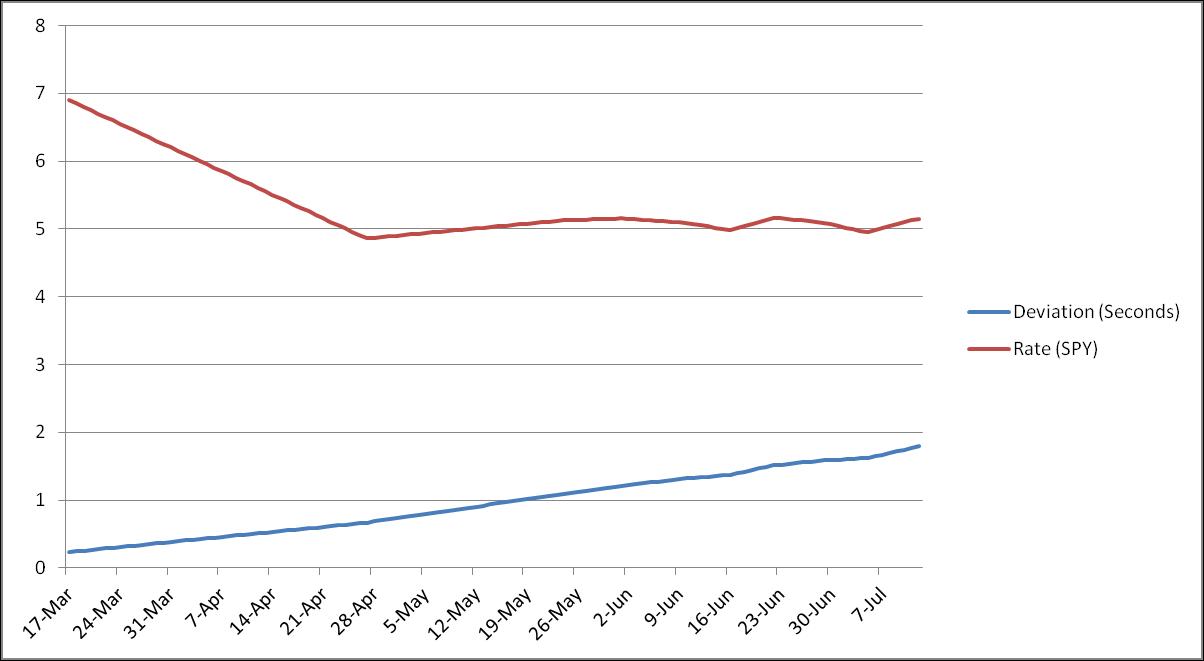
Graph showing the deviation from Standard Time (in seconds) and rate (in seconds per year) for the SP-400
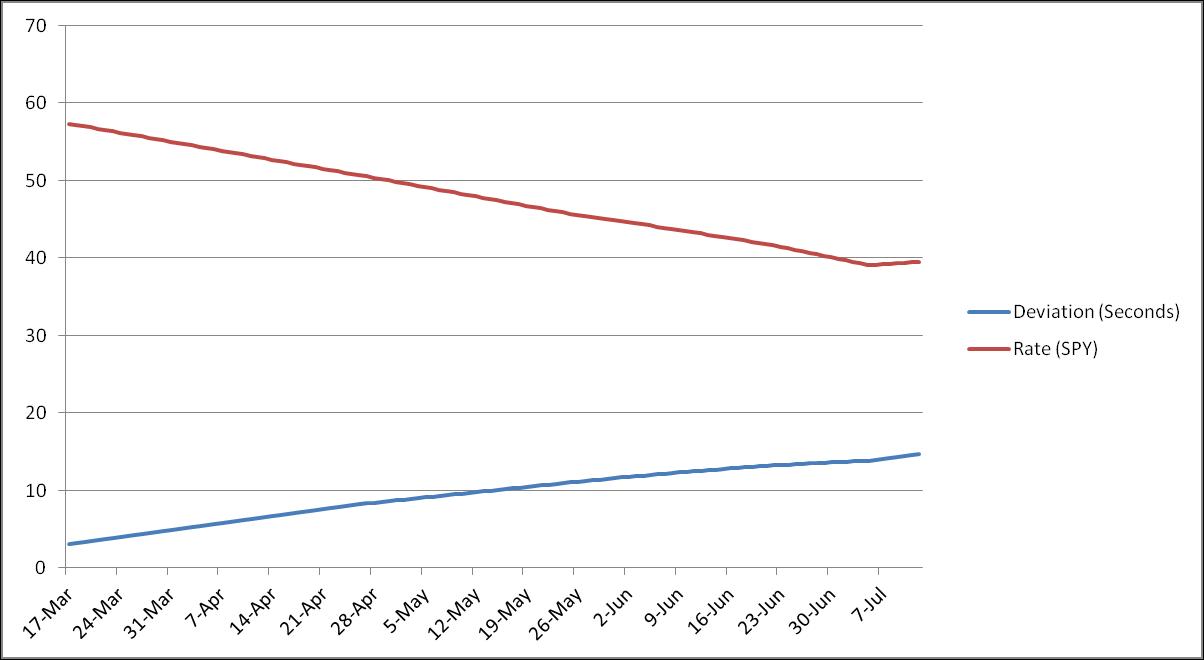
Graph showing the deviation from Standard Time (in seconds) and rate (in seconds per year) for the SP-400G
Graph showing the deviation from Standard Time (in seconds) and rate (in seconds per year) for the Crystron 4 Mega
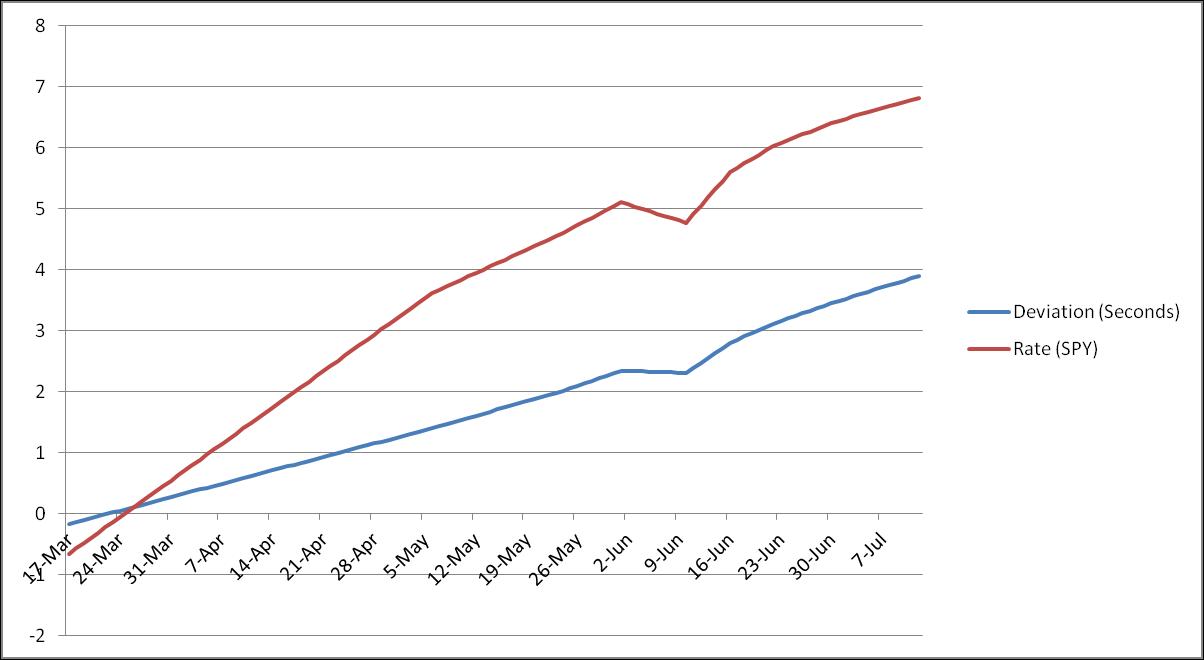
Graph showing the deviation from Standard Time (in seconds) and rate (in seconds per year) for the Exceed 4 Mega
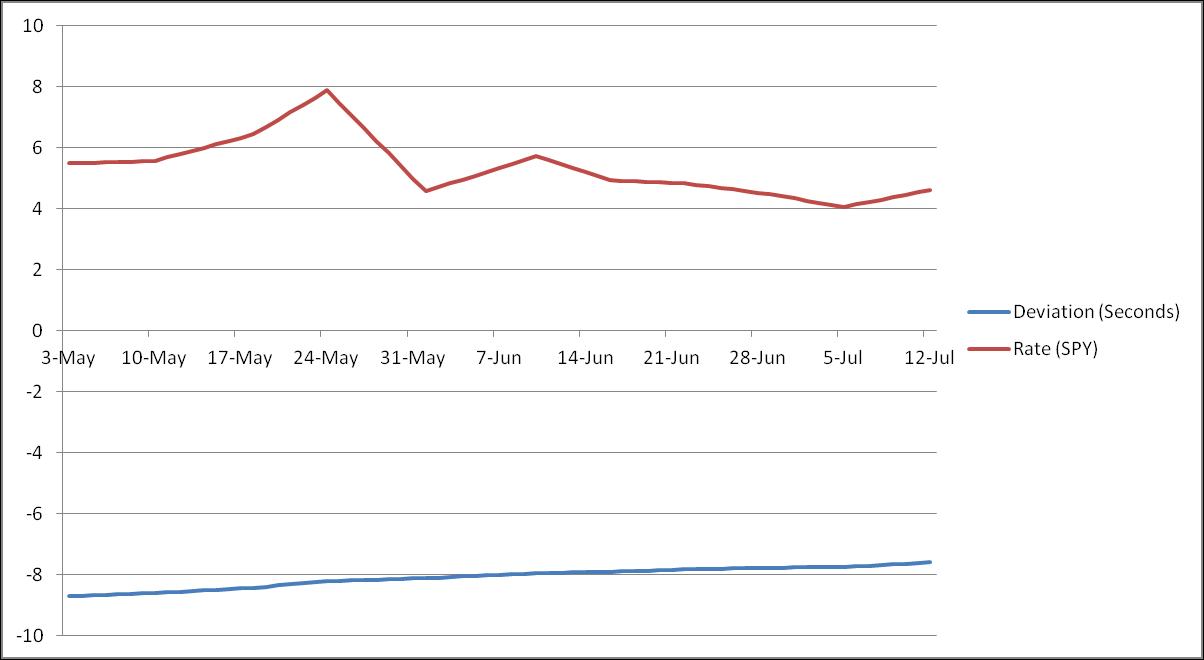
Graph showing the deviation from Standard Time (in seconds) and rate (in seconds per year) for the Omega
A Note on the Accuracy and Reliability of Timing Results
There is always going to be an unknown margin of error in any method of timing, and I estimate that each timing event could be off by as much as 0.1 second (though in practice I believe my results to be somewhat better than this). As a consequence of this potential margin of error, results over short periods of time are unreliable. Ultimately, the only result that matters is that which comes at the end of a full 365 days. Where interim results show consistent timings or steady trends, however, then it is safe to assume that those results are fairly accurate.